
Water pH
A downloadable PDF of this page can be found here.
Accompanying Classroom Worksheet: W-W-03
Objective: Students will use an electrical conductivity meter to determine if water is viable for pH testing, and adjust the conductivity if it is not. Students will use pH paper to determine the hydrogen ion concentration of the water at their field site.
Considerations:
1. In this protocol, we have combined two investigations: electrical conductivity and pH.
The former is to determine the viability of the latter. Each part can of course be performed
independently, but we believe they work best as a pair.
2. We intend for this protocol to be executed monthly so that students may observe how pH changes over time and speculate on the causes. However, if there are time or budget constraints it can be performed less or even only once. You could also use it to compare pH values between sites, such as a pond and a stream.
3. Great care should be taken when working with the electrical conductivity meter. It should be properly calibrated before each use and blotted dry between each test.
4. Samples can either be tested in the field or collected and returned to the classroom for tests. As the water must be at room temperature for proper analysis, the latter option may be best given typical school time constraints.
5. The graphing portions of this protocol require students to perform logarithmic transformations. We have, however, provided resources that calculate this automatically for students who are not yet at that level.
Materials
___ sampling containers (if you are returning samples to the classroom, you may wish for these containers to be sealable. Otherwise, simple plastic cups are acceptable.)
___ thermometer
___ pH paper (or testing strips)
___ electrical conductivity meter
___ table salt
___ stirring rod or spoon
___ Worksheet W-W-03
Instructions
1. Before leaving the classroom, calibrate the electrical conductivity meters per the manufacturer’s specifications.
2. Place the thermometer in the water source and record the initial temperature of the water.
3. Collect your water samples in the sampling containers and return them to the testing area. You may want to rinse your container a few times with your sample to ensure any residue from previous experiments doesn’t interfere with your readings.
4. Place the electrical conductivity meter in the sample, and record the reading.
a. Because pH is essentially a measure of ions, water samples need to have a certain degree of conductivity (also a measure of dissolved ions) in order for pH paper to be an accurate tool. We recommend that samples be above 200 mS/cm.
b. If the sample is below this threshold, add a small pinch of table salt and stir vigorously until it dissolves.
c. Retake the electrical conductivity measurement. If it has surpassed 200 mS/cm, then you’re all set to go. If not, repeat steps 4b and 4c.
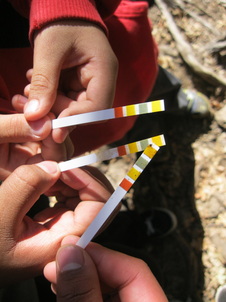
5. Dip the pH paper into the sample, and follow the manufacturer’s instructions to test pH. Record pH on the worksheet provided.
6. Repeat the test on two more samples of the water.
7. Calculate the average pH for the site and record on the table.
a. Because pH is a logarithmic representation of the concentration of hydrogen ions (ie pH = -log([H+])), calculating the arithmetic average is of little use.
b. If your students are old enough to perform logarithmic/exponential calculations, you may choose to have them calculate the average using the formula: [H+] = 10^-pH. Once the pHs are in terms of hydrogen ion concentration, they can be averaged normally and then returned to pH using the equation in part 7a.
c. If your students have not yet learned logarithms, they can go to http://wgr-sw.com/pH/. This website has a tool that allows students to calculate the true average pH of their samples from a standard pH measurement.
8. Repeat the protocol once a month for at least six months, if you are able.
9. Refer to the accompanying worksheet for graphing opportunities and further questions.
___ sampling containers (if you are returning samples to the classroom, you may wish for these containers to be sealable. Otherwise, simple plastic cups are acceptable.)
___ thermometer
___ pH paper (or testing strips)
___ electrical conductivity meter
___ table salt
___ stirring rod or spoon
___ Worksheet W-W-03
Instructions
1. Before leaving the classroom, calibrate the electrical conductivity meters per the manufacturer’s specifications.
2. Place the thermometer in the water source and record the initial temperature of the water.
3. Collect your water samples in the sampling containers and return them to the testing area. You may want to rinse your container a few times with your sample to ensure any residue from previous experiments doesn’t interfere with your readings.
4. Place the electrical conductivity meter in the sample, and record the reading.
a. Because pH is essentially a measure of ions, water samples need to have a certain degree of conductivity (also a measure of dissolved ions) in order for pH paper to be an accurate tool. We recommend that samples be above 200 mS/cm.
b. If the sample is below this threshold, add a small pinch of table salt and stir vigorously until it dissolves.
c. Retake the electrical conductivity measurement. If it has surpassed 200 mS/cm, then you’re all set to go. If not, repeat steps 4b and 4c.
5. Dip the pH paper into the sample, and follow the manufacturer’s instructions to test pH. Record pH on the worksheet provided.
6. Repeat the test on two more samples of the water.
7. Calculate the average pH for the site and record on the table.
a. Because pH is a logarithmic representation of the concentration of hydrogen ions (ie pH = -log([H+])), calculating the arithmetic average is of little use.
b. If your students are old enough to perform logarithmic/exponential calculations, you may choose to have them calculate the average using the formula: [H+] = 10^-pH. Once the pHs are in terms of hydrogen ion concentration, they can be averaged normally and then returned to pH using the equation in part 7a.
c. If your students have not yet learned logarithms, they can go to http://wgr-sw.com/pH/. This website has a tool that allows students to calculate the true average pH of their samples from a standard pH measurement.
8. Repeat the protocol once a month for at least six months, if you are able.
9. Refer to the accompanying worksheet for graphing opportunities and further questions.
